US CLO Market Review: Q1 2026 Issuance, Trends and Outlook
In this US CLO market review, we present high-level data illustrating activity in respect of deals on which the Maples Group was engaged since our last publication of The CLOser, in September 2025. We also look at CLO activity for the entire US market, 2026 year to date (“YTD”), with some comparative data in respect of the same period for 2025.
- Published
- in Industry Updates
At the time of writing, it is important to note that data was only available until around 18 March. Consequently, 2026 data for March is not reflective of activity for the entire month.
Key takeaways
- YTD 2026 new issuance totalled approximately $73.3 billion across ~163 transactions through mid-March, strong in historical terms but down ~4–5% versus the same period in 2025.
- Refi and reset activity is down ~45% YTD as widening spreads reduce manager incentives.
- Open warehouse count stands ~17% higher than the same time in 2025, with durations lengthening.
- Market headwinds, including tariff shifts, credit quality concerns and geopolitical tensions, are tempering the outlook, with consensus 2026 issuance estimates clustering around just under $200 billion.
US CLO Market Activity: Issuance and Deal Flow in 2026
New Issue Volume
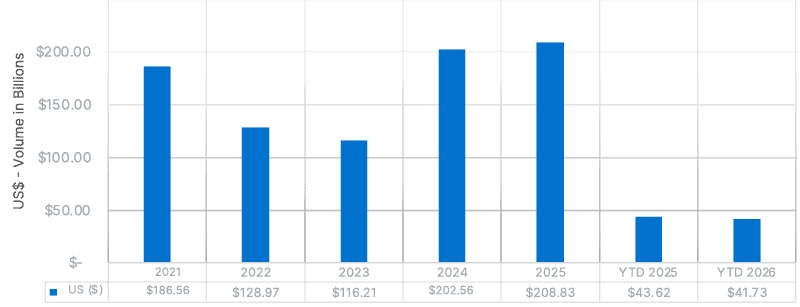
The US CLO market has demonstrated continued resilience in the opening months of 2026, building on a record-setting 2025 in which new issue BSL and middle market CLO volume reached over $200 billion for a second consecutive record year ($203 billion in 2024; $209 billion in 2025). YTD 2026 issuance activity has, overall, been strong. In the first two months of 2026, issuance totalled approximately $73.3 billion across around 163 transactions:
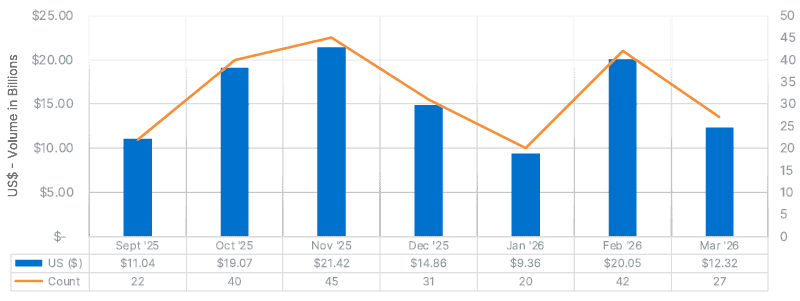
- January: ~70 deals totalling approximately $30 billion, comprising $9.4 billion of new issuance and $21.3 billion of refinancings and resets.
- February: ~95 deals pricing at over $43 billion, including over $20 billion of new issues and $23 billion in refinancing and reset transactions
Figures 1 and 2 illustrate this strong performance in context, both historically with reference to data back to 2021, and more recently on a month-by-month basis. We also include some comparative data for 2025 YTD.
As Figure 1 shows, YTD new issuance is strong in historical terms, although down by around 4-5% compared to the same period in 2025. Despite resilience and considerable momentum at the end of 2025, January was unsurprisingly a softer month compared to December. Market volatility, global uncertainties and domestic concerns around specific industry sectors—particularly software and AI—began to emerge, creating headwinds partway through February and into March.
This is illustrated in Figure 2 which shows CLO new issuance volume by month. Further disruption and waning demand are anticipated as the market assesses additional risks from the ongoing situation in the Middle East, which commenced at the end of February, and the extent of portfolio exposure to energy price inflation.
Refinancing and Reset Activity
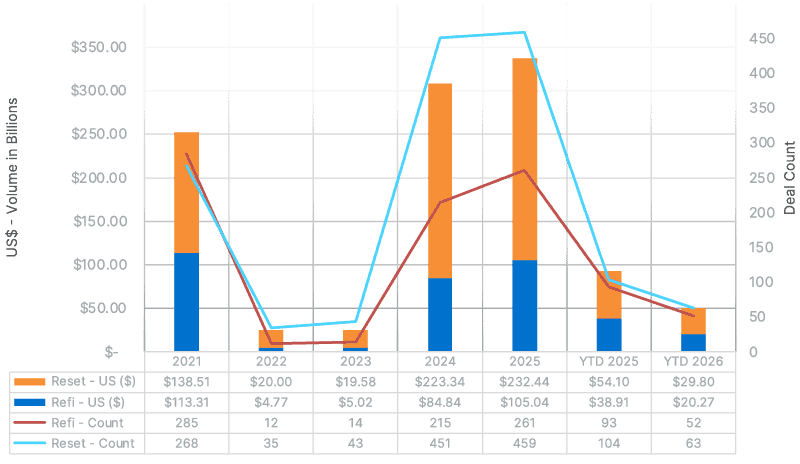
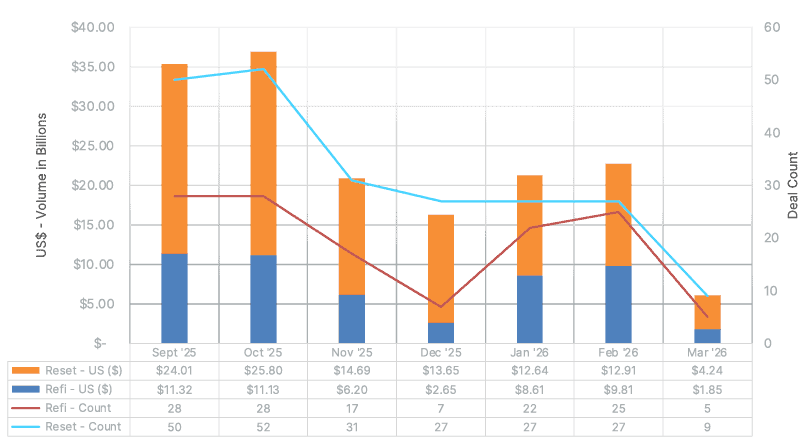
Figures 3 and 4 present refi and reset activity on a yearly basis (covering 2021 onwards) and monthly, respectively. Last year was, of course, an incredible one for refi and reset activity, which surpassed the prior record set in 2024 by around 10%. Activity has subsided in 2026 such that, compared to 2025, YTD is now down by around 45%.
At the time of writing, widening spread levels were reducing the incentive for managers to amend deals. By way of illustration, February’s average weekly BSL refinancing and reset volume total of $5.1 billion sank to $2.4 billion on the same basis through the first three weeks of March.
Deal Size Trends
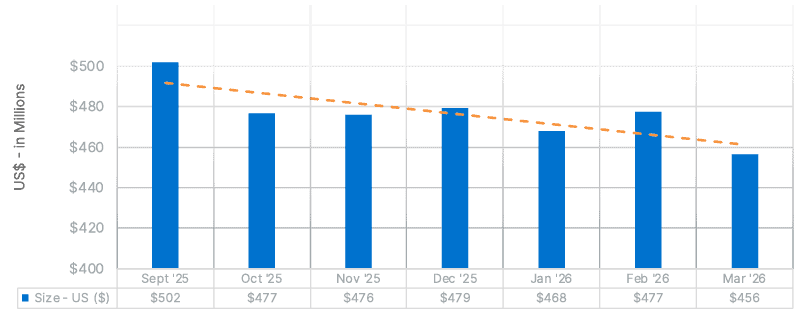
Figure 5 indicates a general downward trend in deal size, with averages in February and March being, respectively, $477 million and $456 million, -10% or so reduced from the September average.
Price-to-Close Periods
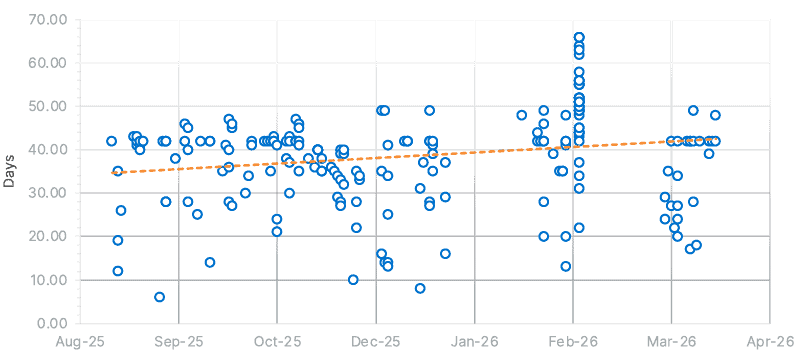
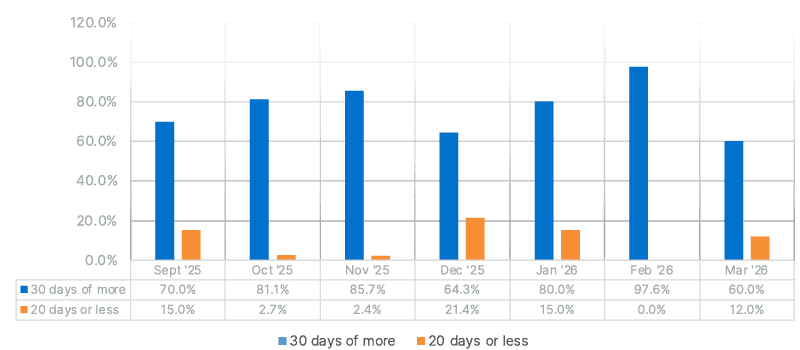
We note a considerable degree of volatility in price-to-close periods from September 2025 to March 2026. While Figure 6a shows the general scatter, Figure 6b gives a sense of the proportion of deals that have price-to-close periods greater than 30 days or less than 20 days.
Notably, in February there were no ‘print-and-sprints’, in strong contrast to December and, to a lesser extent, January. There does appear to be a very generalised trend towards longer ‘priced’ periods – although there are signs this has changed (or is changing) into March, likely linked to enhanced market volatility.
Maples Group CLO Deal Activity
The Maples Group had the pleasure of an exceptional year in 2025 and a very strong year thus far in 2026. We saw a huge number of new instructions in January and there has been a continued growth in our practice, services and teams globally since our last publication. We are extremely proud to have the largest team of dedicated CLO specialists of any service provider, many of whom have greater than 15 years of tenure, underscoring the depth and breadth of experience and stability across the Maples Group.
To supplement our observations on data for the US market as a whole, we now turn attention to the specific deals on which the Maples Group was engaged, and share our insights and observations on the main trends identified:
New SPV Incorporations
September, October and November were very good months for new SPV incorporations. We also started off the year on an exceptionally strong note in January, although activity has since tailed off as market conditions and general sentiment have shifted.
New Warehouses ‘Opened’
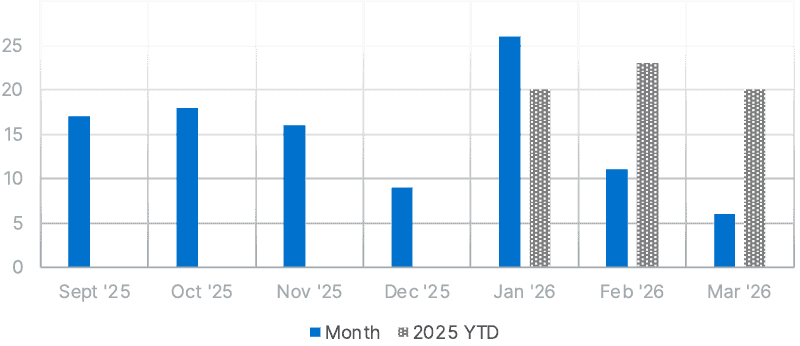
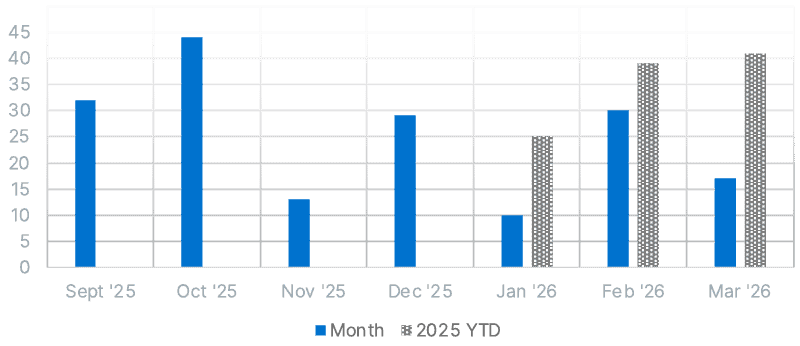
Cumulative warehouse activity for January and February was up 20% compared to 2025, showing good market confidence and a strong pipeline, but again activity has since tailed off into March. Particularly strong months for new warehouses opening were October, December, January and February.
CLO Closings
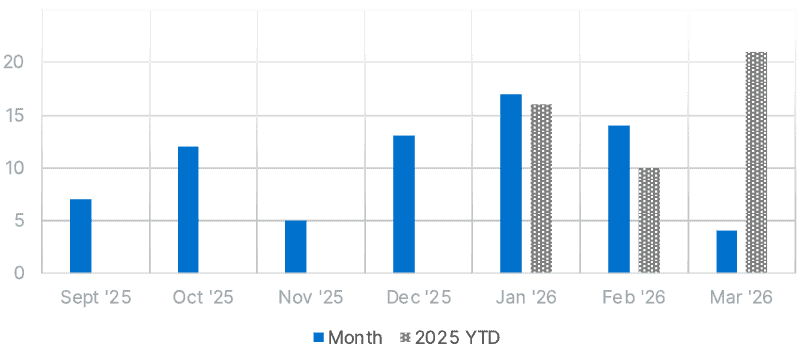
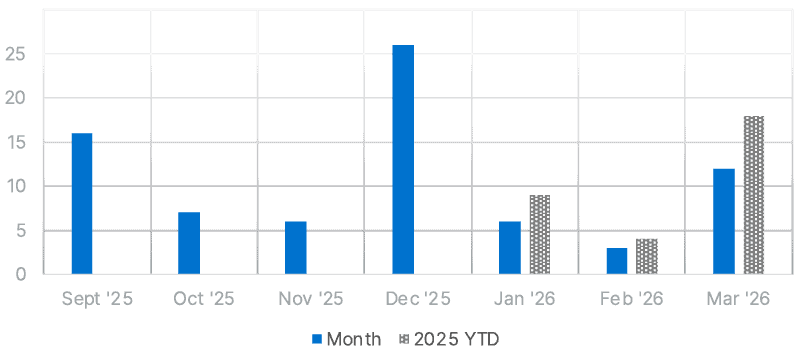
Consistent with the overall position across the US CLO market, our CLO closings YTD are a little down as compared to 2025, but the Maples Group had incredibly strong months in September and December, with March also being a good month in light of the large number of deals that priced during February.
Refi / Reset Closings
Again, consistent with the overall position across the US CLO market, our refi / reset closings YTD are down compared to 2025. February was, however, slightly busier in this regard than December.
CLO Activity Distribution
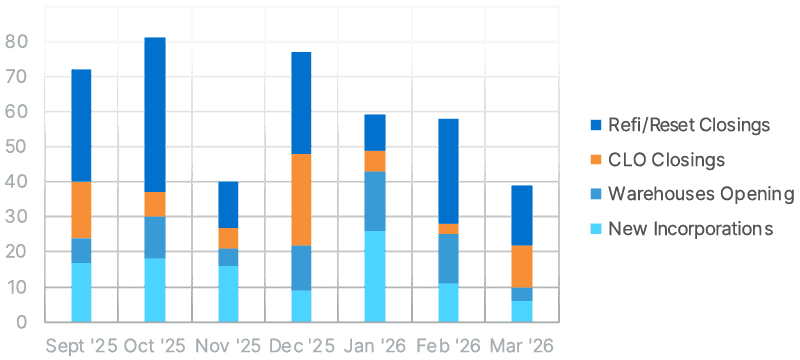
The purpose of this chart is to amalgamate refi / reset closings, CLO closings, warehouse transactions and new incorporations to provide a sense of cumulative activity level through the year thus far. It is interesting to note how the distribution of activity has varied, particularly in the period December through to March. Whereas in December we saw strong activity across all areas, new instructions and warehouses took centre stage in January and February. From February into March, we saw more in the way of CLO closings and refi / resets than new instructions and warehouses. This seems entirely consistent with the shifting tide of sentiment and confidence level in overall outlook.
Total ‘Open’ Warehouses
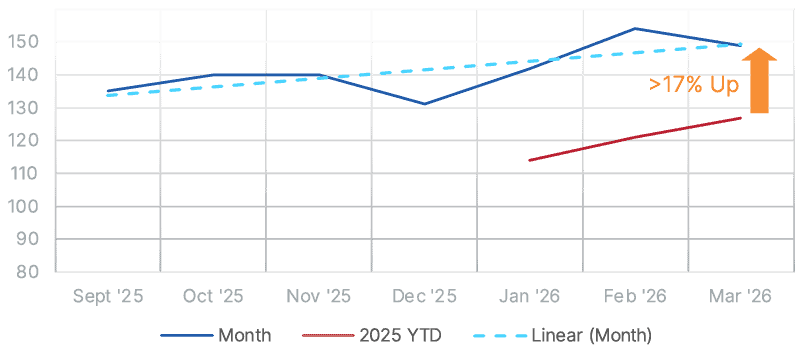
As noted in our prior edition, tracking the number of ‘open’ warehouses is an interesting metric—the actual figure and trend can be interpreted in a variety of ways. Over the review period (September to March), and compared to last year, we have a larger book of open warehouses: 17% higher compared to the same time in 2025 and around 10% growth since September last year. We have witnessed an increase in warehouse durations and a small number of warehouse amendments, terminations or consolidations. This seems commensurate with headwinds in the market; we will be keeping a close track on this metric as the rest of the year unfolds.
Warehouse formation activity had been robust through the end of last year, with it being reported that there were approximately 300 open facilities in the US as of late 2025, a record level likely signalling expectations for continued CLO issuance and strong demand for leveraged loans.
Progress of Warehouses ‘Opened’ YTD
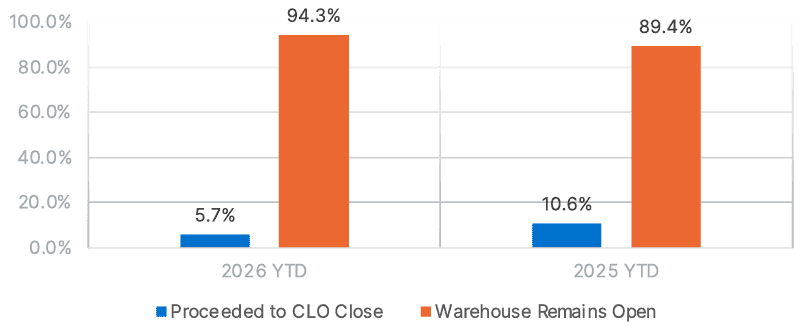
Not surprisingly, the percentage of new warehouses ‘opened’ in 2026 (where the Maples Group has been engaged) and that have proceeded to a successful CLO closing already is rather small, at around 6%. Given the trend in warehouse duration and market conditions, this comes as no surprise or concern but will be monitored as the year progresses. It is, however, perhaps worth noting that the percentage is down compared to the same period in 2025.
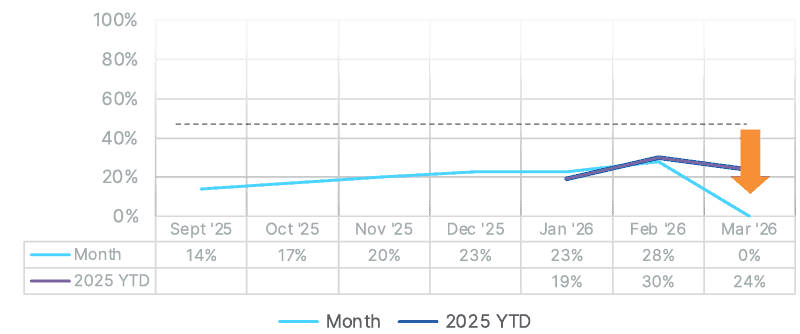
Average % of Warehouses Issuing Pref Shares – Monthly
The issuance of preference shares in warehouse financing structures has historically tended to be seen in, very broadly, 40-60% of warehouse transactions. Neglecting the incomplete data for the full month of March, Figure 14 shows that the trend is generally flat or marginally upwards, but significantly lower in historical terms due to the trend towards investors holding their ‘equity’ interest by way of contractual debt obligations / subordinated notes (e.g. similar to CLO ‘equity’) rather than by way of ‘pure’ equity in the form of preference shares.
New Issuance – Warehouse Durations
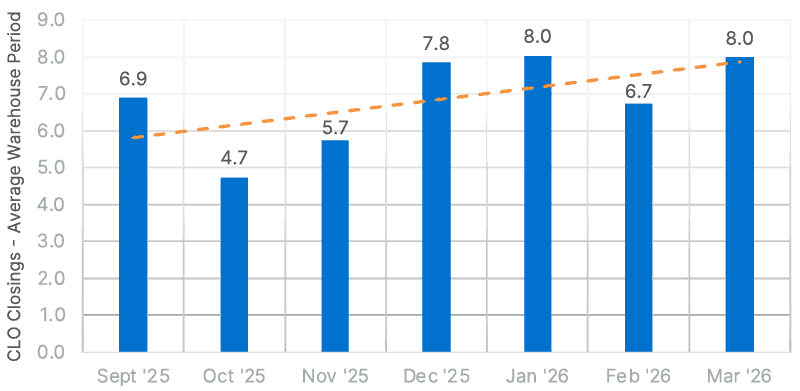
As mentioned above, there has been a trend towards slightly longer warehouse durations in the period September 2025 through to March 2026. For deals that have closed in December through to March so far, the average is 7.5-8 months.
New Issuance Stock Exchange Listings 2026 YTD
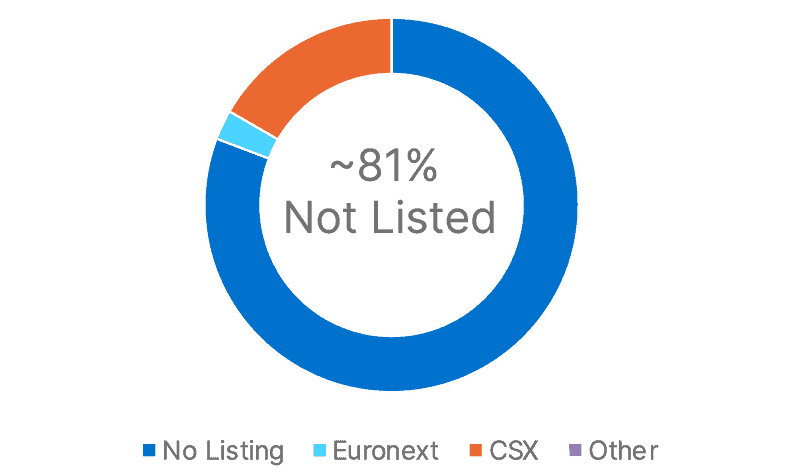
Stock exchange listings continue to be seen on approximately 18-20% of CLO transactions, with the Cayman Islands Stock Exchange (“CSX”) leading over Euronext Dublin. For a more detailed review and analysis, please see our CSX listings update.
2026 US CLO Market Conditions and Outlook
The US CLO market enters the second quarter of 2026 in a position of cautious optimism. At the time of writing, YTD issuance activity had been robust in historical terms, spread levels had been tightening into 2026, and investor demand had supported a significant volume of new supply and refinancing activity. This constructive backdrop was also underpinned by overall declining default expectations, an easing Federal Reserve and a structurally well-positioned CLO market with reinvestment capacity at record levels.
However, widening spreads, increased concerns around weakening credits, and waning demand and confidence is emerging. Commentators suggest that key factors shaping market performance for the remainder of the year include:
- include the trajectory of interest rates and monetary policy;
- the evolution of credit quality in underlying loan portfolios;
- the pace and success of the substantial $422 billion wave of refinancing and reset candidates exiting non-call periods; and
- the capacity of the investor base — including the CLO ETF segment — to absorb continued supply.
The interplay between tariff shifts, inflation, industry sector concerns, the conflict in the Middle East and geopolitical tensions, remain the principal downside risks that could disrupt base-case projections.
Issuance Forecasts
2026 will likely see a contraction from 2025’s record of approximately $209 billion in new issuance, with consensus estimates clustering at present at just under $200 billion, though current (unrevised) forecasts from BNP Paribas ($215 billion) and KBRA ($220 billion) still envision a new record. A resurgence in M&A and LBO activity would be a critical catalyst for growing the collateral pool and improving CLO equity arbitrage economics. It is also suggested that manager discipline regarding collateral quality and portfolio construction will be critical, as credit dispersion intensifies and the margin for error in CLO equity economics narrows.
Conclusion
Although the US CLO market remains a resilient and adaptive segment of the structured credit universe, headwinds from geopolitical tensions, macroeconomic uncertainty, tariff pressures, credit quality deterioration in select sectors, and compressed arbitrage exist and are possibly growing at the time of writing. That said, the fundamental value proposition of CLOs — floating-rate exposure, structural protections, active collateral management and demonstrated resilience during periods of market stress — should hopefully continue to attract capital from a diverse and global investor base.